


Aims of Experiment
Investigate the variables that affect temperature change in chemical reactions, e.g. acid plus alkali.
In this experiment you will:
- react sodium hydroxide solution with hydrochloric acid
- measure the temperature changes during the reaction
- plot a graph of your results and record the temperature change
Risk Asessment
As a general rule, eye protection (goggles) must be worn for all practicals.
| hazard | possible harm | precaution |
|---|---|---|
| dilute sodium hydroxide solution |
skin irritation and serious eye irritation |
avoid contact with skin, rinse off skin if necessary |
| dilute hydrochloric acid |
skin irritation and eye irritation |
avoid contact with skin, rinse off skin if necessary |
This risk assessment is provided as an example only, and you must perform your own risk assessment before doing this experiment.
Apparatus
Each group will need:
100 ml beaker
polystyrene cup
thermometer
hydrochloric acid
sodium hydroxide solution
50 ml measuring cylinder
10 ml measuring cylinder
Experiment Set-up
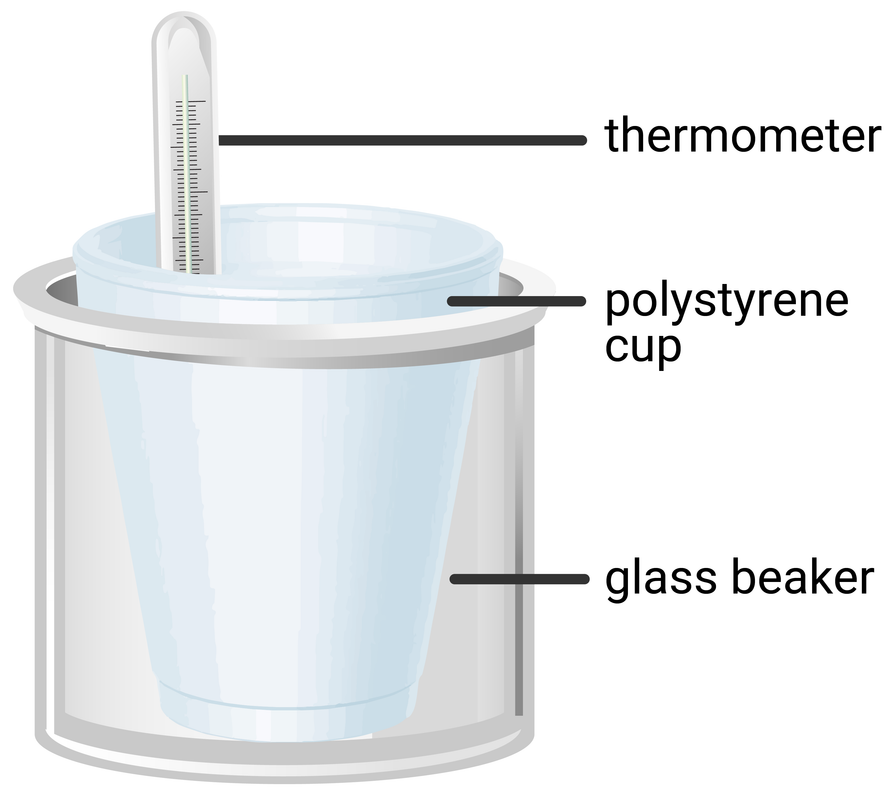
Method
- place a polystyrene cup inside a glass beaker, and (using a measuring cylinder) add 30 ml of hydrochloric acid to the cup
- use a thermometer to measure the temperature of the acid, and record this in a table
- using a measuring cylinder add 5 ml of sodium hydroxide to the cup
- fit the lid and gently stir the solution with the thermometer through the hole
- when the reading on the thermometer stops changing, record the highest temperature that was reached in the table
- repeat steps 3–5 to add further 5 ml amounts of sodium hydroxide to the cup each time until a maximum of 40 ml of sodium hydroxide has been added, recording the temperature in the results table
- wash out all the equipment and repeat the experiment for your second trial
Results and Analysis
| total volume of sodium hydroxide added (ml) | maximum temperature (oC) | ||
|---|---|---|---|
| trial 1 | trial 2 | mean | |
| 0 | |||
| 5 | |||
| ... | |||
| 40 | |||
The bigger the temperature change in the reaction, the more energy is absorbed or released.
Remember that endothermic reactions absorb energy from the surroundings, and exothermic reactions transfer heat into the surroundings.
Calculate the mean maximum temperature reached for each volume of sodium hydroxide. Record these means in your table.
Plot a graph from your results and draw a straight line of best fit.
From the graph read off the maximum temperature change.